Google Analytics Integration
Having good analytics data empowers key decison makers with actionable data to help set business objectives and budgets. (Likewise, a lack of good anlaytics data will leave you 'guessing' where to invest your online marketing and development budget).
The Basics
If you have ever used any kind of analytics software before you will be familiar with the basics of website tracking. Most ecommerce platforms will integrate with common website tracking features such as bounced sessions, measuring engagement with time on site and page view per session, and of course measuring conversion rate.
Bounced Sessions is anytime a visitors arrives at your website (perhaps from a search engine, or a link from another website) and immediately leaves without further browsing on your site. If a particular page on your website has a high bounce rate, it can be an indicator that this page is poor quality or not very engaging to potential customers and may be a good place to invest some resources to improve.
Session Engagement has historically been measured with time on site and page views per session. However with modern websites becoming increasingly dynamic with ajax page refreshes, on page pop-ups or tabbed areas, etc 'page views' is becoming a very loose metric. StoreBuilder will of course continue to allow these basic tracking features to work in Google Analytics (just like everyone else); however, we will introduce some better metrics for tracking user engagement using enhanced ecommerce tracking.
Conversion Rate is the percentage of your visitors who are successfully converted to customers (make a purchase or fulfil other business objective). While conversion rate is a valuable measure of overall website performance, it misses some extremely valuable data: for those visitors who do NOT convert, where or why did the not convert?
Enhanced Ecommerce Tracking
Enhanced Ecommerce Tracking is Google's response to the changing nature of ecommerce websites to fill in the holes where basic analytics don't live up to modern ecommerce tracking demands.
Shopping Behavior Analysis
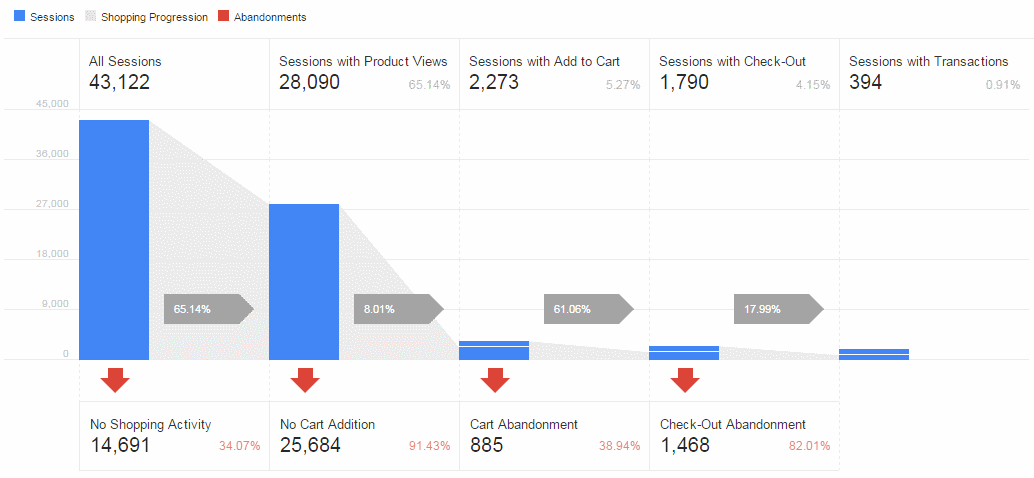
Shopping Behavior Analysis is Google's answer to measuring customer engagement or interest in your products. While more page views could mean more interest from your audience, that metric is less reliable as websites become more and more dynamic; but also a highly interested visitor may proceed straight the product they want and checkout in very few page views, or a "board browser" may stumble around your website for hours with no intention of purchasing.
Shopping Behavior Analysis breaks down customer engagement into a funnel of steps:
- All Sessions
- Sessions with Product Views
- Sessions with Add to Cart
- Sessions with Checkout
- Session with Transactions

Checkout Behavior Analysis
Checkout Behavior Analysis allows you to havegain some insight into why someone might visit the checkout page but not complete their purchase. This is something like measuremeasuring the reciprocal of the conversion rate.
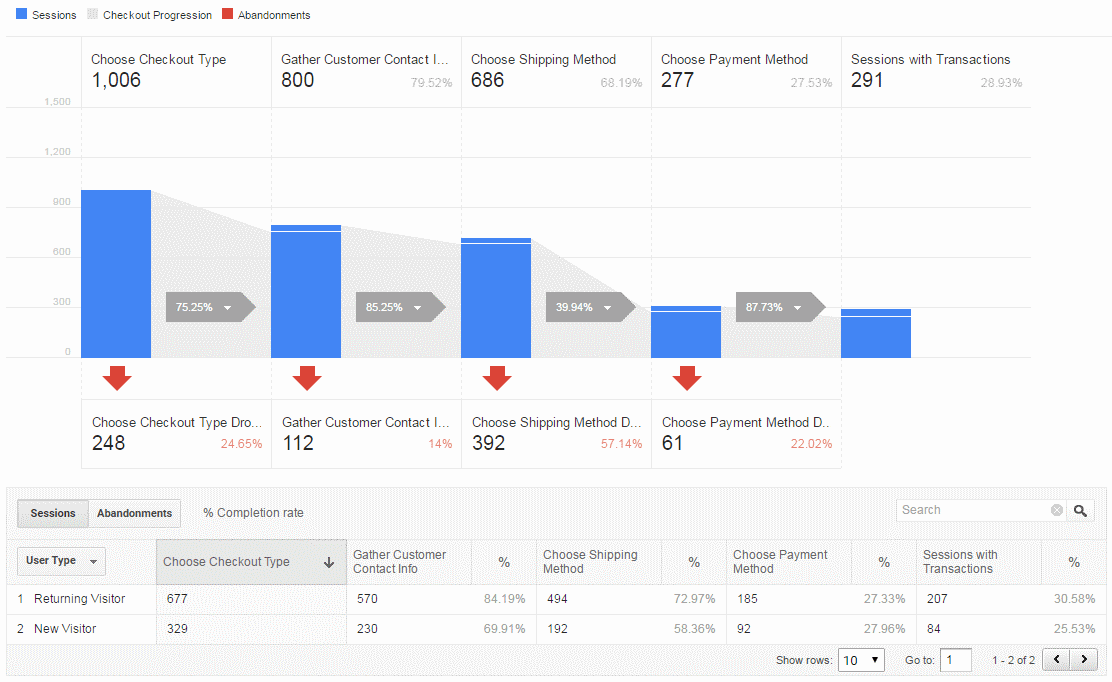
This is accomplished by breaking down the checkout process into component steps and measuring where visitors drop out of the checkout process. Google Analytics allow you to define whatever steps you want in your checkout process, but we have identified the most common checkout process as:
- Choose Checkout Type (Returning Customer, New Customer, or Guest Checkout)
- Gather Customer Contact Information (Billing Address, optionally different Shipping Address)
- Choose Shipping Method (aka Shipping Quote)
- Choose Payment Method (Credit Card, PayPal Express, or other)
- Order
CompleteCompleted (aka 'Transaction')

Using the above example, you can see that the checkout abandonment rate is highest at the Choose Shipping Method step. This featuresuggests willthat bemaybe availablethis bybusiness endmight ofconsider Januarymaking 2016
shipping methods more attractive, reducing shipping costs or some other marketing technique to reduce the abandonment at this checkout step.
Product Performance
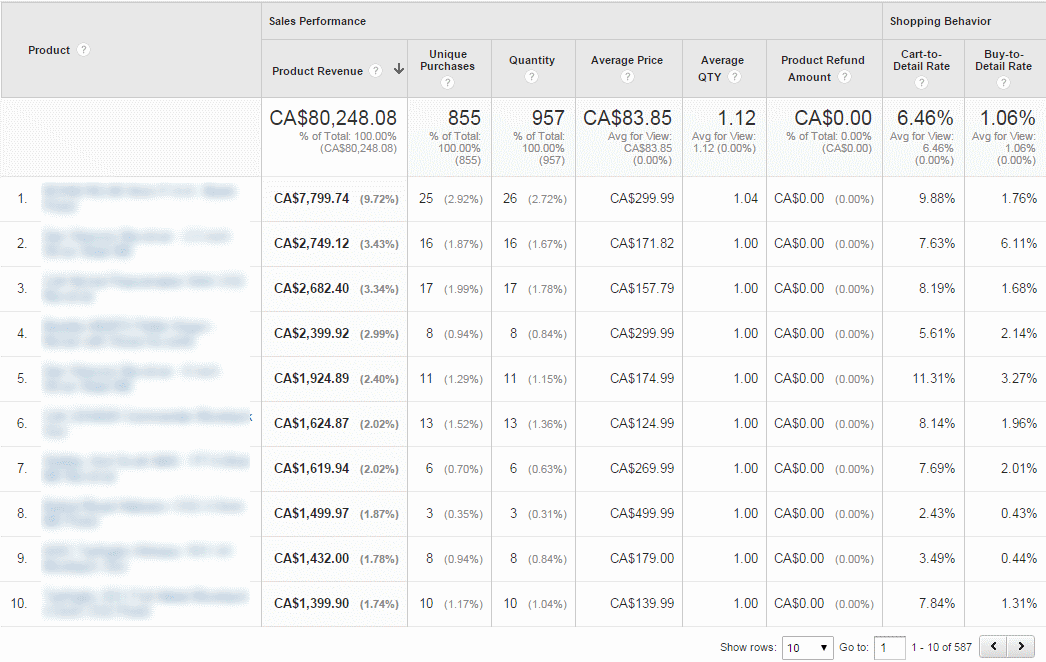
The Product Performance views with Google Analytics will help you identify which products are selling best. You can sort the Product Performance list by Total Produce Revenue, # of Unique Purchases (regardless of quantity per order), # of Purchases (cumulative of all quantities sold).

The Product Performance area also provides you with a bunch of very useful statistics including average quantity purchased, cart-to-detail rate and buy-to-detail rate.
Cart to Detail rate is the percentage breakdown of how many people add to cart after viewing the product details. Buy to Detail rate is the percentage breakdown of how many people end up purchasing after viewing the product details.
Both are useful as an indicator of how well you are serving your audience of potential customers. If a user has viewed the product details, they have shown some interest in the product by clicking through some kind of listing page to see more information. If you have a low add-to-detail rate, it may be an indicator that the information available regarding that product is not enough to satisfy customers' needs and you might consider improving the product photos, description or other resources.
Product List Performance
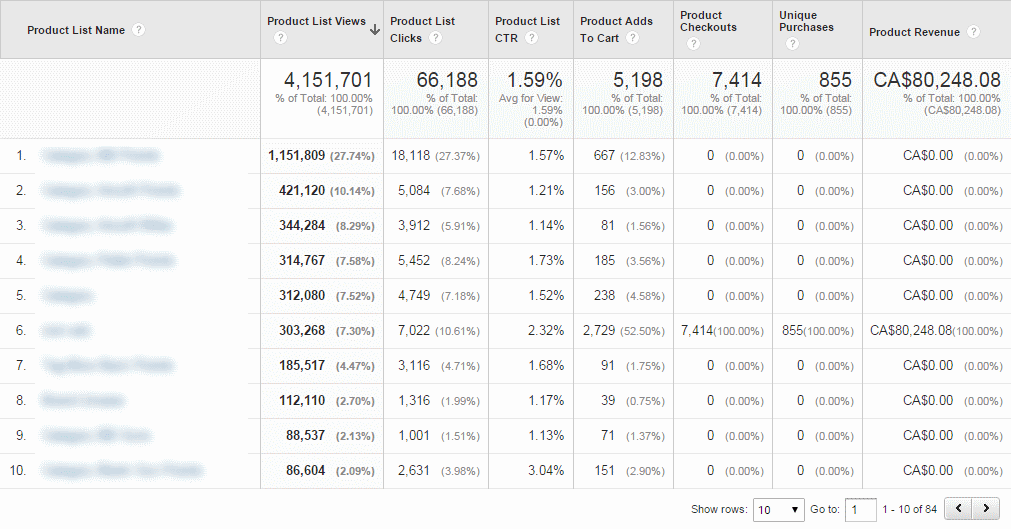
The Product List Performance view in Google Analytics will allow you to see which listing pages on your website are performing best. The same product might appear in multiple listings throughout your website. For example a kids bunk bed might be listed under the category "bunk beds" as well as the category "kids beds" in two locations on your website. However it is entirely possible the customers don't think to look in one category or the other, and you may find one product listing out performs the other.

Product Listing CTR (Click Through Rate) is the percentage of time visitors click through a listing to see more product details.
Product Adds to Cart is the number of times a visitors adds a product to their cart after having clicked through from a listing.

